catinstalbans
Well-known member
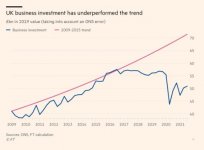
I'm a teacher and don't follow business investment so could you Business Experts or English Nationalists please enlighten me on what might be the cause of the change in the pattern here. Analysing graphs is a typical maths skill for science and we practise with many examples.
Clearly the first mark would be obtained for a correct description of the pattern- Business Investment was generally increasing in the UK until 2016 but then levelled off.
What could possibly have caused such a change?
Clearly the first mark would be obtained for a correct description of the pattern- Business Investment was generally increasing in the UK until 2016 but then levelled off.
What could possibly have caused such a change?